
You've probably noticed the "Optimization Level" setting in your Xcode project's Build Settings. -Onone, -O, -Osize... What's all this about? And more importantly, why does your app crawl in Debug but fly in Release? Let's break down these options that make a real difference.
1. What is Compiler Optimization?
The Concept
When you write Swift code, the compiler (swiftc) transforms it into executable machine code. But between your source code and the final binary, it can make choices:
- Keep the code as-is: easy to debug, but not optimized
- Reorganize and simplify: faster at runtime, but harder to debug
- Compress as much as possible: smaller binary, but speed trade-offs
These choices are controlled by the optimization level.
Why Does It Matter?
The difference is far from trivial:
| Aspect | Without optimization | With optimization |
|---|---|---|
| Execution speed | Baseline | 2x to 10x faster |
| Binary size | Larger | Up to 30% smaller |
| Compile time | Fast | Slower |
| Debugging | Perfect | Limited or impossible |
An algorithm that takes 500ms in Debug can drop to 50ms in Release. It's not magic, it's the compiler doing its job.
2. The Different Optimization Levels
Swift offers four main optimization levels. Here's the breakdown of each.
-Onone (No optimization)
Optimization Level = None [-Onone]
What it does:
- No optimization
- Generated code matches exactly what you wrote
- All variables are preserved
- All function calls are explicit
When to use it:
- Debug: this is the default and the right choice
- When you need step-by-step debugging
- When you want readable stack traces
Pros:
- Fast compilation
- Perfect debugging (breakpoints, variables, step-by-step)
- Predictable behavior
Cons:
- Poor performance
- Larger binary
// With -Onone, this function stays as-is
func calculateSum(_ numbers: [Int]) -> Int {
    var sum = 0
    for number in numbers {
        sum += number  // Breakpoint here: you can see 'sum' and 'number'
    }
    return sum
}
-O (Optimize for Speed)
Optimization Level = Optimize for Speed [-O]
What it does:
- Aggressive speed optimizations
- Function inlining (code is copied instead of called)
- Dead code elimination
- Loop unrolling
- Constant propagation
- And many other transformations...
When to use it:
- Release: this is the default and recommended choice
- When performance is the priority
- For production
Pros:
- Optimal performance
- Best quality/speed ratio
Cons:
- Slower compilation
- Very limited debugging (variables "optimized out")
- Sometimes incomplete stack traces
// With -O, the compiler can transform this...
func calculateSum(_ numbers: [Int]) -> Int {
    var sum = 0
    for number in numbers {
        sum += number
    }
    return sum
}

// ...using SIMD vector instructions,
// or fully inline if called with constants
let result = calculateSum([1, 2, 3, 4, 5])  // Can become directly 15
-Osize (Optimize for Size)
Optimization Level = Optimize for Size [-Osize]
What it does:
- Optimizes to reduce binary size
- Less inlining (avoids code duplication)
- Prefers function calls over copies
- Keeps some speed optimizations when they don't bloat the code
When to use it:
- Apps with size constraints (App Clips limited to 15 MB)
- Extensions (widgets, notifications) with tight budgets
- Emerging markets where download size matters
Pros:
- Significantly smaller binary (10-30% depending on the case)
- Decent performance (not as fast as -O, but not catastrophic)
Cons:
- Slightly slower than -O
- Limited debugging like -O
// With -Osize, a function called 50 times won't be inlined
// → 1 copy of the code instead of 50
func formatPrice(_ value: Double) -> String {
    return String(format: "%.2f €", value)
}
Concrete comparison:
| Metric | -O | -Osize |
|---|---|---|
| Binary size | 100% (baseline) | ~70-90% |
| Performance | 100% (baseline) | ~95-98% |
The trade-off is often excellent: you lose 2-5% perf to gain 10-30% size.
-Ounchecked (Unchecked optimization)
Optimization Level = Optimize for Speed, Unchecked [-Ounchecked]
⚠️ Warning: dangerous option
What it does:
- All -O optimizations
- Removes runtime safety checks:
- Arithmetic overflows
- Out-of-bounds array access
- Force-unwrap of nil
- Preconditions and assertions
When to use it:
- Almost never in practice
- Ultra performance-critical code already proven correct
- After profiling and identifying checks as the bottleneck
Pros:
- Theoretical maximum performance
- Can make a difference in intensive numeric code
Cons:
- Undefined behavior if a check would have failed
- Silent crashes, possible memory corruption
- Very hard to debug
- Potential security vulnerabilities
// With -Ounchecked, this code doesn't crash, it corrupts memory
let array = [1, 2, 3]
let value = array[10]  // -O → crash with "Index out of range"
                       // -Ounchecked → undefined behavior 💀
My advice: forget this exists. The gains are marginal and the risks are enormous. If you need this level of performance, you already know what you're doing (and you're probably using C or Rust for those parts).
3. Whole Module Optimization (WMO)
Beyond optimization level, there's another crucial setting: Whole Module Optimization.
What is it?
By default, Swift compiles each file separately. With WMO, the compiler sees the entire module at once and can make optimizations otherwise impossible.
Compilation Mode = Whole Module
What it enables
Without WMO (file by file):
// FileA.swift
func helperFunction() -> Int { return 42 }

// FileB.swift
func mainFunction() -> Int {
    return helperFunction()  // Compiler doesn't know what helperFunction does
                             // → must make a real function call
}
With WMO:
// The compiler sees both files together
// → can inline helperFunction directly
func mainFunction() -> Int {
    return 42  // No more function call!
}
Optimizations enabled by WMO
- Cross-file inlining: inline functions defined in other files
- Global dead code elimination: remove code never called in the entire module
- Devirtualization: transform dynamic calls into static calls
- Generic specialization: generate optimized versions for concrete types
Performance impact
WMO can bring 10-20% additional gains, sometimes more. It's particularly effective for:
- Protocols with known implementations
- Generics used with concrete types
- Well-structured code with small functions
The trade-off: compile time
| Mode | Incremental compile time | Clean compile time |
|---|---|---|
| File by file | Fast (only recompiles modified files) | Normal |
| Whole Module | Slow (recompiles entire module) | Similar |
In Debug, you want fast incremental builds → file by file. In Release, you want the best performance → Whole Module.
Configuration in Xcode
The setting is found in Build Settings:
Compilation Mode:
- Incremental (file by file)
- Whole Module
Or via the flag:
SWIFT_COMPILATION_MODE = wholemodule
4. Configuring in Xcode
Via the Interface
- Open your project in Xcode
- Select your target
- Build Settings tab
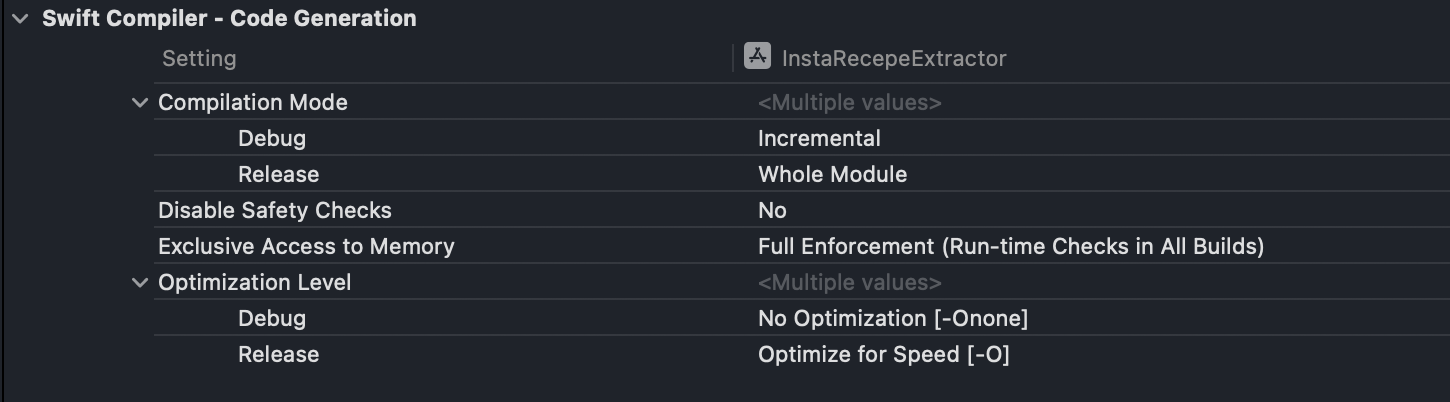
- Search for "Swift Compiler - Code Generation"
You'll find:
| Setting | Key | Options |
|---|---|---|
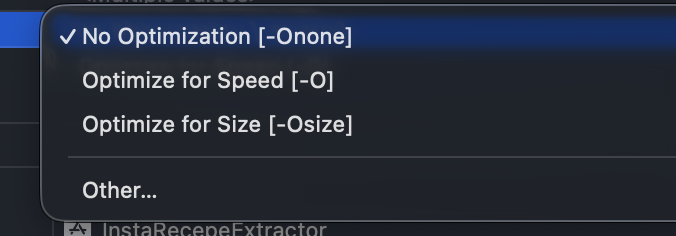
| Optimization Level | SWIFT_OPTIMIZATION_LEVEL | -Onone, -O, -Osize, -Ounchecked |
| Compilation Mode | SWIFT_COMPILATION_MODE | incremental, wholemodule |
Available Optimization Level options:
Recommended Configuration
By default, Xcode configures this correctly:
| Configuration | Optimization Level | Compilation Mode |
|---|---|---|
| Debug | -Onone | Incremental |
| Release | -O | Whole Module |
Don't change this without good reason. These defaults are the result of Apple's experience and thousands of projects.
Checking the Effective Configuration
To verify what's actually applied:
- Build Settings → "Levels" view
- You see where each value comes from (default, project, target, xcconfig)
5. Configuring in .xcconfig Files
Like other flags, centralizing in xcconfig files is a best practice.
Example Configuration
Config/Debug.xcconfig:
// Debug: no optimization, fast compilation
SWIFT_OPTIMIZATION_LEVEL = -Onone
SWIFT_COMPILATION_MODE = incremental

// Assertions active
SWIFT_ACTIVE_COMPILATION_CONDITIONS = DEBUG
Config/Release.xcconfig:
// Release: maximum optimizations
SWIFT_OPTIMIZATION_LEVEL = -O
SWIFT_COMPILATION_MODE = wholemodule

// No assertions in prod
SWIFT_ACTIVE_COMPILATION_CONDITIONS =
Config/ReleaseSmall.xcconfig (if you need a size-optimized config):
// Release optimized for size (App Clips, extensions)
SWIFT_OPTIMIZATION_LEVEL = -Osize
SWIFT_COMPILATION_MODE = wholemodule
For Extensions with Size Constraints
If you have an App Clip or widget with a tight size budget:
// WidgetExtension.xcconfig
SWIFT_OPTIMIZATION_LEVEL = -Osize
SWIFT_COMPILATION_MODE = wholemodule

// Also enable stripping
STRIP_STYLE = all
DEPLOYMENT_POSTPROCESSING = YES
6. Concrete Impact on Your Code
What Changes with Optimizations
Let's take a concrete example to understand what the compiler does.
Source code:
struct Point {
    var x: Double
    var y: Double

    func distance(to other: Point) -> Double {
        let dx = other.x - x
        let dy = other.y - y
        return sqrt(dx * dx + dy * dy)
    }
}

func totalDistance(_ points: [Point]) -> Double {
    var total = 0.0
    for i in 0..<(points.count - 1) {
        total += points[i].distance(to: points[i + 1])
    }
    return total
}
With -Onone:
- Each call to
distance(to:)is a real function call - Variables
dx,dy,totalexist in memory - Array accesses go through bounds checks
- You can set a breakpoint anywhere
With -O + WMO:
distance(to:)is inlined in the loop- Intermediate calculations stay in CPU registers
- The loop can be vectorized (SIMD)
- Bounds checks can be hoisted out of the loop or eliminated
- The final code looks more like optimized C
Debugging in Optimized Mode
When debugging a Release build, you'll often see:
(lldb) po total
error: <EXPR>:3:1: error: use of unresolved identifier 'total'
Or in the debugger:
total = <optimized out>
That's normal: the variable no longer exists, the compiler optimized it away. That's why you debug in Debug, not Release.
Assertions and Preconditions
Assertion behavior changes with config:
| Function | -Onone | -O | -Ounchecked |
|---|---|---|---|
assert() | ✅ Active | ❌ Ignored | ❌ Ignored |
assertionFailure() | ✅ Crash | ❌ Ignored | ❌ Ignored |
precondition() | ✅ Active | ✅ Active | ❌ Ignored |
preconditionFailure() | ✅ Crash | ✅ Crash | ❌ Ignored |
fatalError() | ✅ Crash | ✅ Crash | ✅ Crash |
Practical consequence:
func processIndex(_ index: Int, in array: [Int]) -> Int {
    // In Release with -O, this check is still executed
    precondition(index >= 0 && index < array.count, "Index out of bounds")

    // This one is ignored in Release
    assert(index >= 0, "Negative index")  // Debug only

    return array[index]
}
Use precondition for checks that must stay in prod, assert for those only useful in dev.
7. Advanced Use Cases
Optimizing a Specific Target Differently
You can have a different config per target. For example, your compute-intensive framework in -O even in Debug:
- Select the framework target
- Build Settings → Optimization Level
- Change the Debug value to
-O
Or via a dedicated xcconfig for the framework.
Profiling Builds
For profiling with Instruments, you want:
- Optimizations enabled (otherwise you're profiling slow code)
- Debug symbols available (to see function names)
Xcode has a Profile configuration for this, or you can create your own:
// Config/Profile.xcconfig
SWIFT_OPTIMIZATION_LEVEL = -O
SWIFT_COMPILATION_MODE = wholemodule

// Keep symbols for profiling
DEBUG_INFORMATION_FORMAT = dwarf-with-dsym
GCC_GENERATE_DEBUGGING_SYMBOLS = YES
Analyzing Binary Size
To understand what takes up space and whether -Osize is worth it:
# Binary section sizes
size -m MyApp.app/MyApp

# Symbols sorted by size
nm -S --size-sort MyApp.app/MyApp | tail -50
Or use Bloaty for detailed analysis:
brew install bloaty
bloaty MyApp.app/MyApp -d compileunits
8. Good Practices and Common Mistakes
❌ Enabling Optimizations in Debug
// BAD - Debug with -O
Debug: SWIFT_OPTIMIZATION_LEVEL = -O
Symptoms:
- Breakpoints don't stop where you want
- Variables "optimized out"
- Incomprehensible stack traces
- Longer Debug compile times
Keep -Onone in Debug.
❌ Disabling Optimizations in Release
// BAD - Release without optimization
Release: SWIFT_OPTIMIZATION_LEVEL = -Onone
Your app will be 2 to 10 times slower than necessary. Users will feel it.
❌ Using -Ounchecked "for perf"
The gains are marginal (a few %) and the risks are enormous. I've seen apps silently crash in prod because an overflow went unnoticed. Don't do this.
❌ Forgetting WMO in Release
// BAD - Release without WMO
Release: SWIFT_COMPILATION_MODE = incremental
You're losing 10-20% free performance.
❌ Testing Performance in Debug
"My algorithm is too slow" → Test in Release before concluding. The difference can be dramatic.
✅ Recommended Typical Configuration
| Config | Optimization | Compilation Mode | Use case |
|---|---|---|---|
| Debug | -Onone | Incremental | Daily dev |
| Release | -O | Whole Module | Production |
| Profile | -O | Whole Module | Instruments profiling |
| ReleaseSmall | -Osize | Whole Module | App Clips, extensions |
9. Final Checklist
Before shipping:
□ Debug uses -Onone and Incremental (fast compilation, debugging OK)
□ Release uses -O and Whole Module (optimal performance)
□ No -Ounchecked (unless you really know what you're doing)
□ If size constrained: -Osize for relevant targets
□ Performance tests done in Release, not Debug
□ Profiling done with debug symbols enabled
□ All targets have consistent configs
□ CI uses the right configurations for each build type
Visual Summary
                    OPTIMIZATION
    ────────────────────────────────────────►

    -Onone          -Osize           -O              -Ounchecked
    │               │                │               │
    ▼               ▼                ▼               ▼
    No              Minimal          Maximum         Max speed
    optimization    size             speed           (dangerous)

    ✅ Debug        ✅ App Clips     ✅ Release      ⛔ Avoid
    ✅ Debugging    ✅ Extensions    ✅ Production


                    COMPILATION MODE
    ────────────────────────────────────────►

    Incremental                      Whole Module
    │                                │
    ▼                                ▼
    File by file                     Entire module

    ✅ Debug (fast builds)           ✅ Release (best optimizations)
Further Reading
If you want to dig deeper:
- Swift.org - Whole Module Optimization: the official article
- WWDC 2015 - Optimizing Swift Performance: a bit dated but the principles still hold
- Swift Compiler Performance: technical compiler documentation
And if you want to see what the compiler really does with your code, check out Godbolt Compiler Explorer with Swift support: you can see the generated assembly based on optimization level. Fascinating (and sometimes scary).